Net Sales
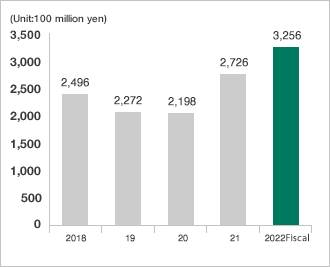
Operating Income
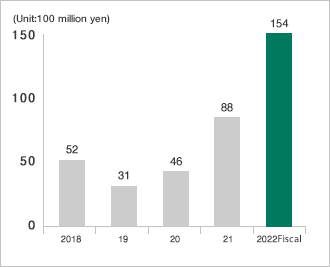
Ordinary Income
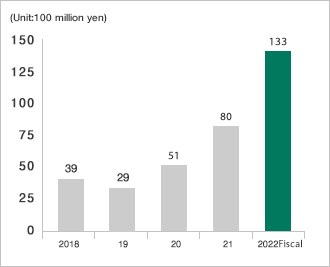
Net Income
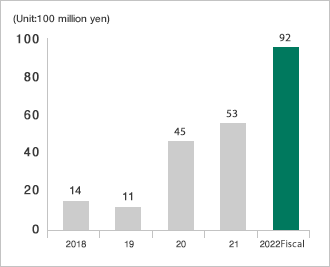
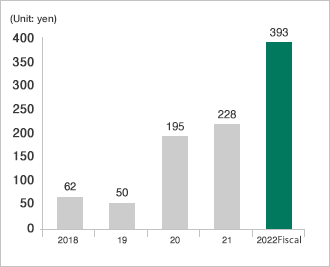
Net Income per Share
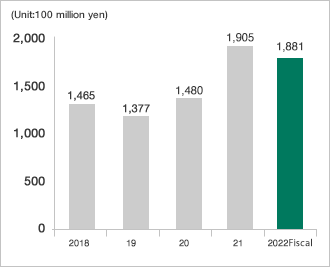
Total Assets
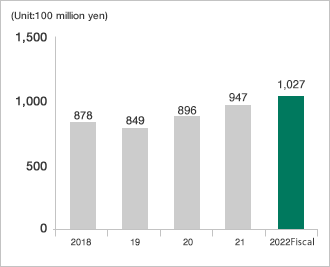
Net Assets
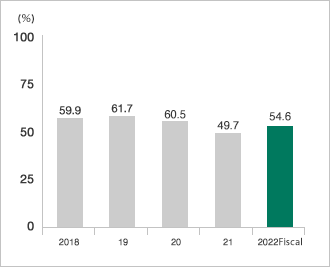
Net Assets to Total Assets Ratio
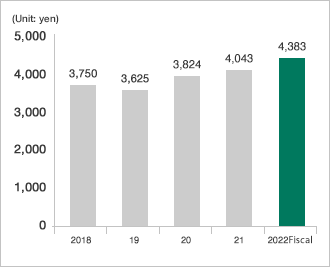
Net Assets per Share
| Dividends per share (yen) | Total dividends |
Consolidated payout ratio |
Consolidated dividends on equity | |||||
|---|---|---|---|---|---|---|---|---|
| End of first quarter | End of first half | End of third quarter | Year-end | Annual | (million yen) | (%) | (%) | |
| Fiscal 2022 | - | 75.00 | - | 90.00 | 165.00 | 3,870 | 41.9 | 3.9 |
| Fiscal 2021 | - | 50.00 | - | 70.00 | 120.00 | 2,811 | 52.5 | 3.1 |
| Fiscal 2020 | - | 30.00 | - | 70.00 | 100.00 | 2,342 | 51.1 | 2.6 |
| Fiscal 2019 | - | 50.00 | - | 30.00 | 80.00 | 1,874 | 157.0 | 2.2 |
| Fiscal 2018 | - | 75.00 | - | 75.00 | 150.00 | 3,522 | 241.6 | 3.9 |


